Support
 What's New
 Contact
 Purchase
 |
Home Page | Support |
What's New |
Contact |
Purchase |
| ChartMaker for LiveCode by www.FlexibleLearning.com |
USER EXPERIENCES
Articles written by Users about ChartMaker for LiveCode
If you have a story, tips to share or an article on 'good practice', contact us to publish it here.
I began to work with Chartmaker because I couldn't find a library for creating graphs in LiveCode that satisfied my requirements. I immediately found it to be wonderful tool."
~ Yves Coppe, Doctor in Belgium
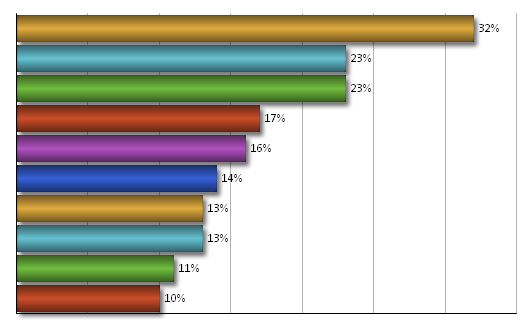
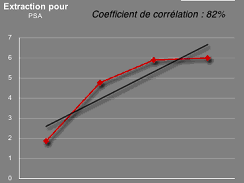
| Ten cool things about ChartMaker | by Dr Yves Coppe |
|
My name is Yves Coppe and I am a doctor in Belgium supporting education. I began to work with Chartmaker because I couldn't find a library for creating graphs in LiveCode that satisfied my requirements. I immediately found it to be a wonderful tool. How I have applied ChartMaker Ten Cool Things about ChartMaker
|
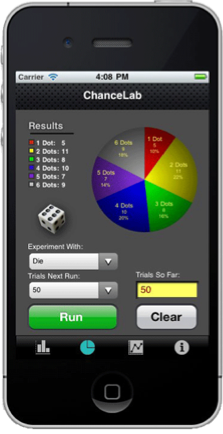
| ChartMaker on iOS | by George C Brackett |
|
My name is George Brackett. I am an educational technology designer with a persistent interest in developing tools for learning. ChanceLab is an interactive iPhone/iPod app that displays the results of probability as an exploratory environment for investigating random behavior.
Why I chose ChartMaker Easy to experiment with chart options I couldn't be happier with my choice of ChartMaker, and the many users of ChanceLab would certainly agree. |
ChartMaker for LiveCode is Copyright © 2012 The Flexible Learning Company. All rights reserved.